by Annalyn Blanchard
Overview of the Program:
Logger Pro is an educational program created by Dave Vernier. In college, Dave used tools that would become the basis of Vernier’s core curriculum of physics/other science fields. Vernier became a high school physics teacher and his wife Christine is a business manager. Dave’s biggest challenge during his job as a teacher for about 8 years was keeping his students engaged during the lesson or the lab. He found that he could keep them engaged through creative, interactive labs. Since the 1980s, Vernier has partnered with famous companies such as Texas Instruments, and has expanded into products the support chemistry, biology, engineering, environmental science, and other sciences.
The Vernier Logger Pro program was originally only a physics program, but has broadened to many other areas of science. In Chemistry here at AHS, we use this program for the majority of our labs. Logger Pro uses several different types of sensors/products, including temperature probes, colorimeters, conductivity probes, and more. This program can be used to monitor different conditions of the lab and create a graph of the value’s change over time so these values can be analyzed after the lab is complete. In both Honors and AP Chemistry we have used this program a lot, so I’m pretty familiar with the program.
How to Use the Program during a Lab:
During my about 1 ½ years in Chemistry we have done many labs that use Logger Pro. The lab I will go through in this blog post will be a lab that we most recently did while using Logger Pro: The Beer’s Law lab. This lab is about how the concentration of a solution affects the absorbency (how much light the solution absorbs when light is passed through it) of a solution. Beer’s Law relates these two values and states that these values have a direct relationship (meaning if the concentration increases, the absorbance value will also increase) in the formula, A = εcl (where A = absorbance, ε = molar extinction coefficient, c = concentration, and l = pathlength).
Sample Lab Procedure:
(I'm skipping the set up part since Logger Pro isn't used for this part in the lab. Assume all of the solutions have been prepared and everything has been set up except for Logger Pro).
- Open Logger Pro.
- Open "Chemistry with Vernier".
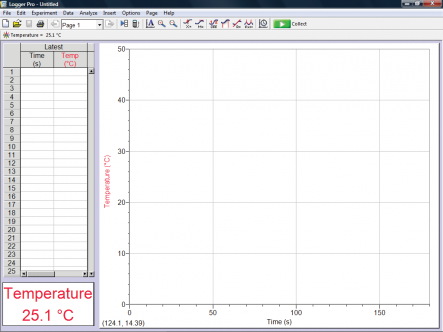
- Click on "11: Determining the Concentration of a Solution: Beer's Law (the screen should then look like this).

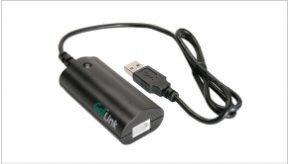
- Connect an Interface to the computer (via USB), and Connect a Calorimeter to the Interface.

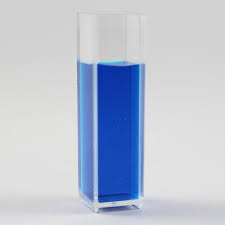
- Pour your already prepared solution into the cuvette until it is about 3/4 full.
- Place the Cuvette into the colorimeter (the sides without the ridges on it facing the arrow in the colorimeter. Close the colorimeter.
- Press the green "Collect" button at the top of the screen
- Wait until the absorbance value stabilizes, then press the keep button (next to where the collect button was). When the window pops up, enter in the concentration of the solution you used and press enter. This should add a point to the graph on the right side of the screen.
- Repeat the last four steps for the rest of the solutions. Make sure to empty and rinse out the cuvette before each solution.
- When finished with the 5 solutions with known concentrations, press the "Stop" button (where the "Collect" button was).

- Empty and rinse out the cuvette, and then fill it with the unknown solution until it's about 3/4 full.
- Close the colorimeter and wait until the absorbance value stabilizes (Don't press "Collect" as you don't need this value on the graph/saved).
- Select the part of the graph with the five points on it (like you would select text).
- Click the "Analyze" tab at the top of the screen.
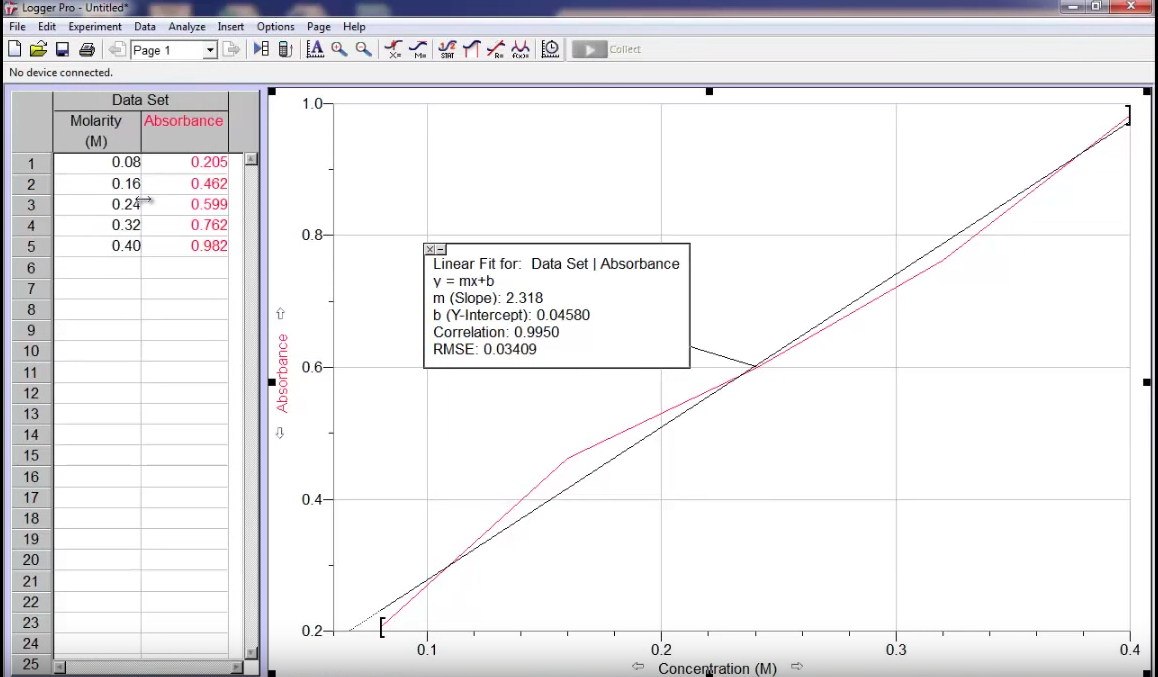
- In the dropdown menu, click "Linear Fit"
- A Line of Best Fit should be created for the five points on your graph, as well as a box that includes the equation of the line.
- You can then calculate the concentration of the unknown solution by plugging the absorbance value recorded earlier into the equation.
- Another way you can calculate the concentration is by hovering your mouse over the graph until the absorbance value in the box is/is close to the absorbance value for the unknown solution. The corresponding concentration value is the concentration of the unknown solution.
- You can print out the graph if needed, but the lab is now complete.
Logger Pro can be used in many different ways and can aid in finding certain values or just monitoring a variable in a reaction/lab for a certain period of time. The Beer’s Law Lab was our most recent lab with Logger Pro, so I decided to use this as an example for this tutorial. Overall, I like this program and find it very easy to use once you get used to it. This program can be used for many different experiments and it is very useful for our Chemistry Labs.
Vernier Website:
Video Showing the Lab with a Similar Way that we did it:
Comments
Post a Comment